

by Daniel J. Schaeffler, Ph.D. | Many companies stipulate a maximum thinning requirement of 20 percent for their stamped parts. Fatigue or durability concerns offer valid reasons for this cut-off. When it comes to formability, maximum allowed thinning should be based on the capability of the sheet metal instead of an arbitrary value.
The sheet metal blank formed to make your engineered stamping starts with known dimensions and a fixed volume. For a rectangular blank, the volume derives from multiplying the width, pitch and thickness. The dimensions change when formed, but the sheet metal volume remains the same.
This approach also applies to discrete sections of the entire blank. Consider a cylindrical region encompassed by a small circle on the surface and descending through the sheet metal thickness. As an example, we know the starting volume if we etch a precise 0.100-in.-dia. circle and measure the thickness using point micrometers or a calibrated ultrasonic thickness (UT) gauge.
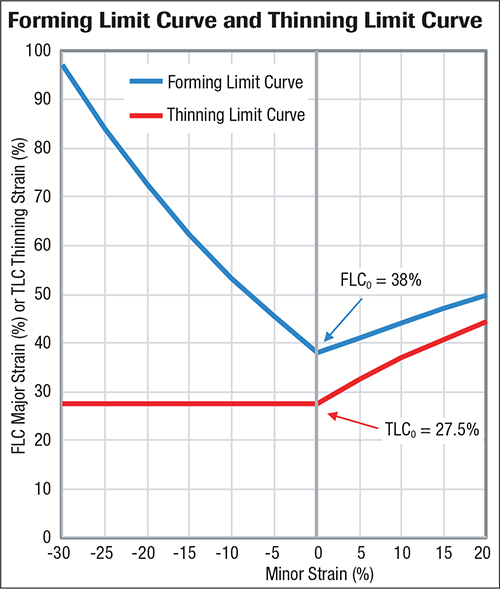 |
| These curves were generated for 0.8-mm-thick low-carbon steel with an n-value of 0.23. |
Material movement resulting from the forming process changes the shape of the circle to an ellipse. Forming the sheet redistributes the material in that cylinder but will not change the total volume. Measuring the dimensions of what is now an ellipse on the surface combined with the thickness in the now-formed area confirms this.
The percentage change in a given dimension is defined as the strain in that direction. Major strain, noted as eMa, is determined from the longest dimension of the formed ellipse. Minor strain, emi, is determined from the dimension perpendicular to the major strain direction.
Forming does not change the volume of the region incorporated by the surface ellipse, so the percent change in volume equals 0. Thickness strain, et, is calculated from the major strain and minor strain on the surface. The percentages must be converted into decimals.
Equation 1
(eMa +1) * (emi +1) * (et +1) = 1
or
et = 1 / (1+eMa )×(1+emi) – 1
As an example, assume that forming results in the long dimension of the ellipse increasing in length by 25 percent relative to the initial circle diameter, and the dimension perpendicular to that decreasing by 10 percent. The thickness strain is calculated as -11.1 percent, or a thickness reduction of a little more than 11 percent.
et = Thickness Strain (%) = 1 / (1+0.25) × (1+[-0.10]) – 1
= 0.889 -1 = -0.111 = -11.1%
Converting FLC to TLC
The forming limit curve (FLC) is a plot that shows the boundary between neck-free and necked strain conditions, with the major strain plotted on the vertical axis and the minor strain graphed on the horizontal axis.
FLC0 is defined as the lowest point on the FLC and occurs at zero minor strain. For low-carbon steel,
Equation 2
FLC0 = (23.3+14.2t) x (n/0.21)
where t is the sheet thickness in millimeters, and n is the n-value. As an example, 38 percent is the calculated value of FLC0 for a 0.8-mm-thick deep-drawn steel having an n-value of 0.23.
We use the relationship between major, minor and thickness strain to convert an FLC to a thinning limit curve (TLC). The value of FLC0 represents the major strain at zero minor strain. Substitute these values into equation 1 to calculate the thinning strain at this location:
et = 1 /(1+FLC0 )×(1+0) -1
= 1 / (1.38)×(1) – 1 = 0.725 – 1 = -0.275 = -27.5%
Thus, the forming process can tolerate a thinning reduction of as much as 27.5 percent in areas with zero minor strain when using this steel. Considering that we started with a thickness of 0.8 mm, thinning down to 0.58 mm can be tolerated before necking begins.
The entire FLC contains values for major–minor strain pairs that can be converted to thickness strain in the same manner. The accompanying graphic on the next page shows the curves generated for 0.8-mm-thick low-carbon steel with an n-value of 0.23. Any major-minor strain point on the blue FLC has a corresponding thickness-minor strain point on the TLC.
Although this example highlights a low-carbon steel, the steps to convert from an FLC to a TLC can be applied to any sheet metal where the FLC has been determined.
No Circles Needed
The constant thinning-limit strain on the left-hand side of the TLC is an artifact of the slope on the left-hand side of the FLC for low-carbon steel. This behavior allows for a shortcut when analyzing a part stamped from a similar alloy.
The procedure for evaluating a part against the FLC involves applying a grid or speckle pattern to the flat blank, forming the part, and then measuring the changes in the shape and location of the pattern. Accurate measurements via this time-consuming process typically requires the purchase of equipment and an experienced practitioner.
Evaluating against the TLC, a faster and easier process, requires only limited training with tools likely available at most manufacturing plants–a micrometer or a UT gauge. Using a micrometer, a formed part must be sectioned to analyze all areas of concern. A UT gauge enables faster, less labor-intensive studies.
Part evaluation against the TLC: Measure and record thickness across the formed part. Calculate thinning strain by comparing against the initial thickness of the sheet metal. Be sure to use the measured thickness and not the minimum ordered thickness.
Equation 3
Thinning strain (%) = et
= (formed part thickness-initial blank thickness) / (initial blank thickness)) * 100%
Compare this thinning strain against the lowest point on the TLC, which for low-carbon steels is the horizontal line. A measured strain lower than the limit strain means a lower risk for necking failure.
If the strains plot on the right-hand side, a part can thin even more than what is indicated by the horizontal line and still carry acceptable strains. You need the FLC to determine this threshold, since the limit changes with minor strain.
A part deemed acceptable when evaluated against a TLC is mathematically equivalent to being acceptable against a FLC. Undertaking a forming limit diagram analysis becomes necessary only when the strains on a part are not satisfactory when evaluated against the TLC. Another benefit of the grid or speckle application of FLD analysis: ability to see the metal-flow direction, which helps with determining corrective actions.
Many companies stipulate a maximum thinning requirement of 20 percent for their stamped parts. Fatigue or durability concerns offer valid reasons for this cut-off. When it comes to formability, maximum allowed thinning should be based on the capability of the sheet metal instead of an arbitrary value.
Want to learn more about different sheet metals and formability? Attend PMA’s Sheetmetal Formability of Steel, Aluminum and Stainless Steels seminar in Grand Rapids, MI, June 11-12. Visit www.pma.org to register or contact Marianne Sichi for information.
 Danny Schaeffler, with 30 years of materials and applications experience, is co-founder of 4M Partners, LLC and founder and president of Engineering Quality Solutions (EQS). EQS provides product-applications assistance to materials and manufacturing companies; 4M teaches fundamentals and practical details of material properties, forming technologies, processes and troubleshooting needed to form high-quality components. Schaeffler, who also spent 10 years at LTV Steel Co., received his Bachelor of Science degree in Materials Science and Engineering from the Johns Hopkins University in Baltimore, MD, and Master of Science and Doctor of Philosophy degrees in Materials Engineering from Drexel University in Philadelphia, PA. Danny Schaeffler Tel. 248/66-STEEL E-mail ds@eqsgroup.com: or Danny@learning4m.com